
Quantifying Plastic Mulch Fragments with ImageJ
Summary
To quantify the amount of plastic mulch fragments collected from soil sampling in a field, measure the size of the fragments by photographing the fragments and analyzing the photographs using ImageJ, a software that is freely available and relatively easy to use. The methods described here work well for dark color (e.g., black and green) plastic mulch.
Quantifying Plastic Mulch Fragments with ImageJ
When soil-biodegradable plastic mulch is tilled into the soil after the growing season, the mulch will be broken into fragments by the tillage operation and the mulch fragments will be dispersed in the soil. Over time, the soil-biodegradable plastic mulch will further deteriorate and degrade, and mulch fragments will become smaller and smaller. The degradation rate of plastic mulch fragments is an important index of mulch degradation and field plastic contamination.
Plastic mulch fragments remaining in the soil can be measured by collecting plastic mulch fragments from the field (see Measuring Plastic Mulch Residues in Fields), taking photographs of them, and analyzing the photographs using ImageJ, a software that is freely available and relatively easy to use. The ImageJ analysis works well for dark color (e.g., black and green) plastic mulch, and the color threshold settings described below are designed for these colors of plastic mulch fragments. For light color plastic mulch (e.g., white), more complex adjustments to the color threshold settings may be required.
Supplies
- Ruler for setting the scale in ImageJ
- White paper for placing plastic mulch fragments and writing the sample number being photographed
- Digital camera for taking photos
- Computer with ImageJ software to measure area of plastic mulch fragments in the photographs; software is available for free at ImageJ
In the Field
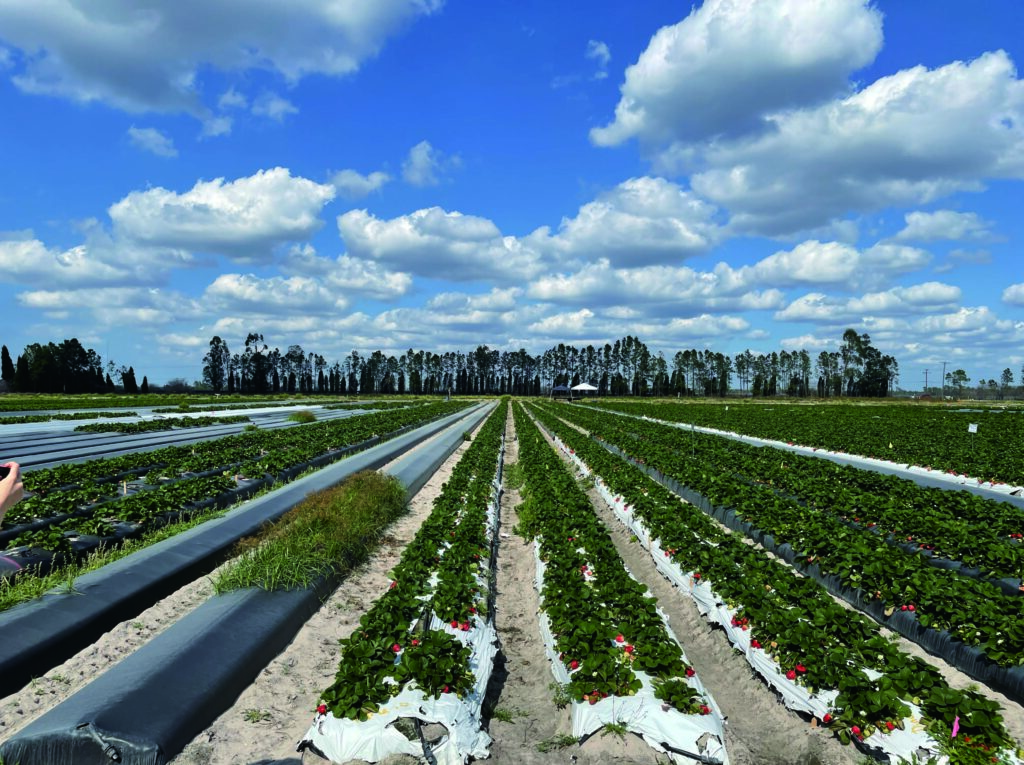
In this example, soil-biodegradable plastic mulch film was used in strawberry field production. Strawberries were planted into mulch-covered raised beds (Figure 1) at the Northwestern Washington Research and Extension Center in Mount Vernon, WA. After the growing season, strawberry plants and soil-biodegradable plastic mulch were tilled into the soil with a rototiller. Visible plastic mulch fragments were collected from the field following the field soil sampling protocol Soil Sampling Plastic Mulch. Following that protocol, the mulch samples were processed in the laboratory using wet sieving, and mulch fragments were pressed and dried in preparation for ImageJ analysis.
In the Laboratory or Farm Shop
Mulch fragment cleaning and camera preparation
- Wash the collected, sieved plastic mulch fragments to remove any attached soil or organic matter (e.g., plant roots).
- Place each cleaned fragment on a white paper sheet, cover with another white paper sheet, and press with a weight (e.g., books). This step will flatten the fragments, facilitating image area measurement.
- Once the fragments are fully air-dried and flattened, photograph them with a digital camera – a good quality phone camera or a professional camera (e.g., Nikon D5100 with a DX Nikkor 18-55 mm objective lens).
- Mount the camera on a stand 50 cm above the mulch sample, with the camera lens pointing downward vertically.
- Place a ruler next to the fragments in each image to provide a reference scale for subsequent image analysis.
On the computer
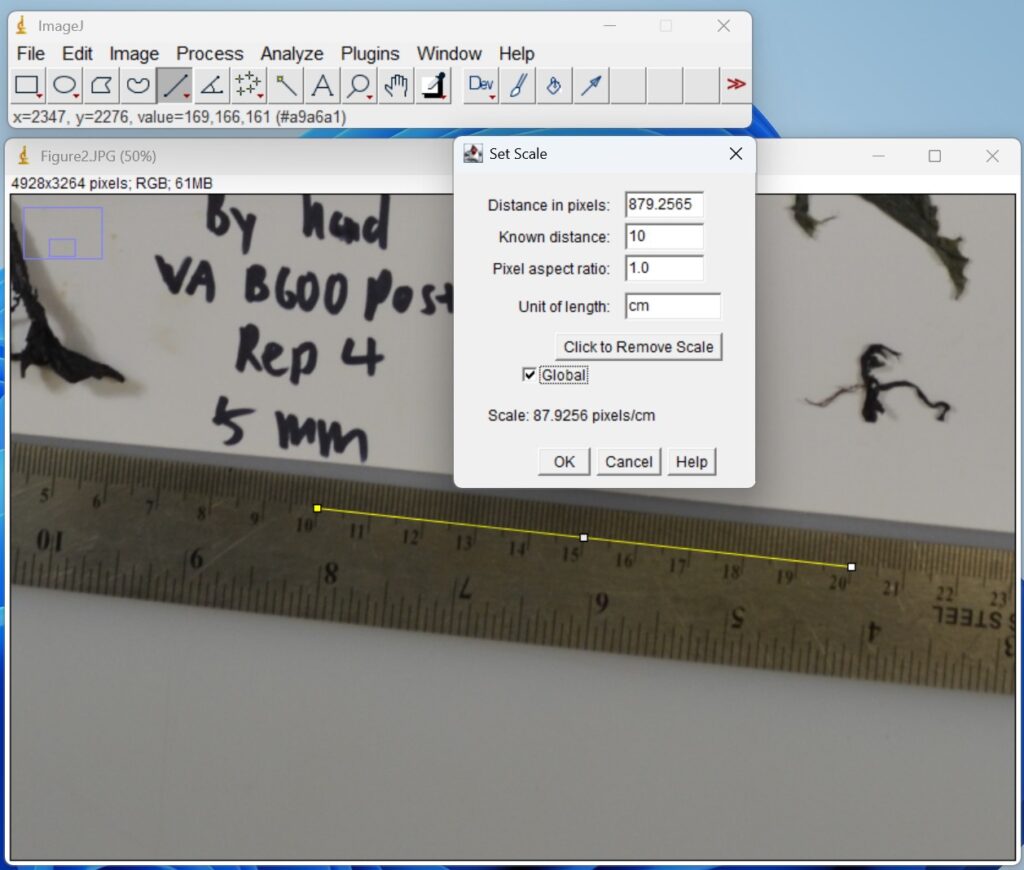
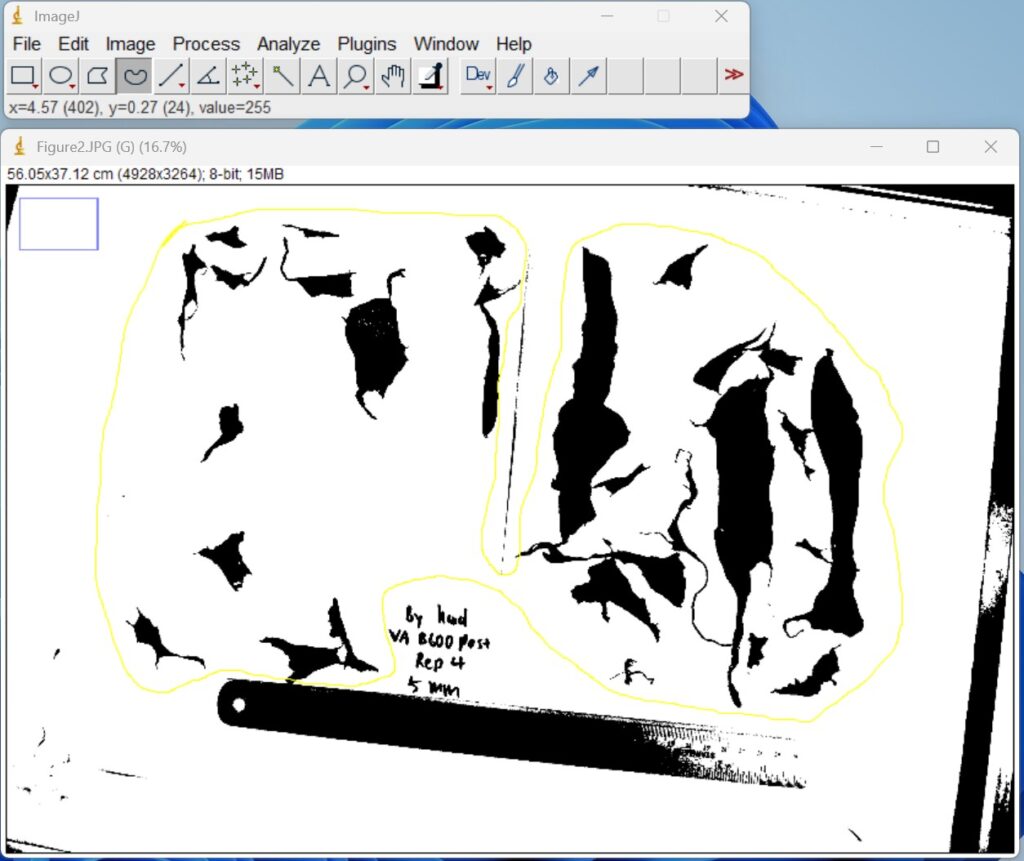
- Name each photo so they have identifying file names. For example, use the naming convention “Location SamplingDate Field Replicate Size” (Figure 2).
- Save the photos in JPEG format.
ImageJ analysis
- Open ImageJ.
- Open ‘Image file’, ensure the scale is set correctly by clicking the straight-line icon on the top toolbar, then clicking and dragging to draw a line along the edge of the ruler. You may need to zoom in (Image → Zoom → In) to ensure the line is drawn precisely along a known distance on the ruler (i.e., 10 cm). Click ‘Analyze → Set Scale’. For ‘Known Distance’, enter the length of the line drawn (e.g., 10), and for ‘Unit of Length’, enter cm. Ensure that ‘Global’ is checked, then click ‘OK’.
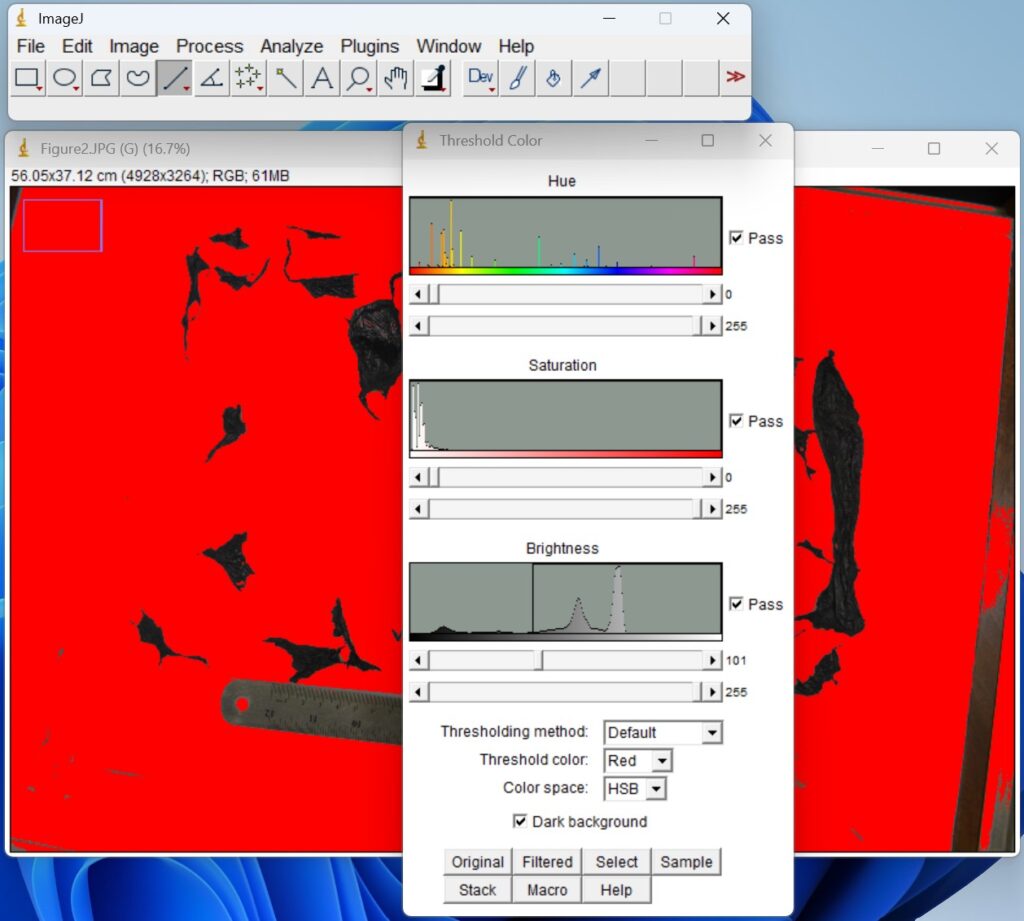
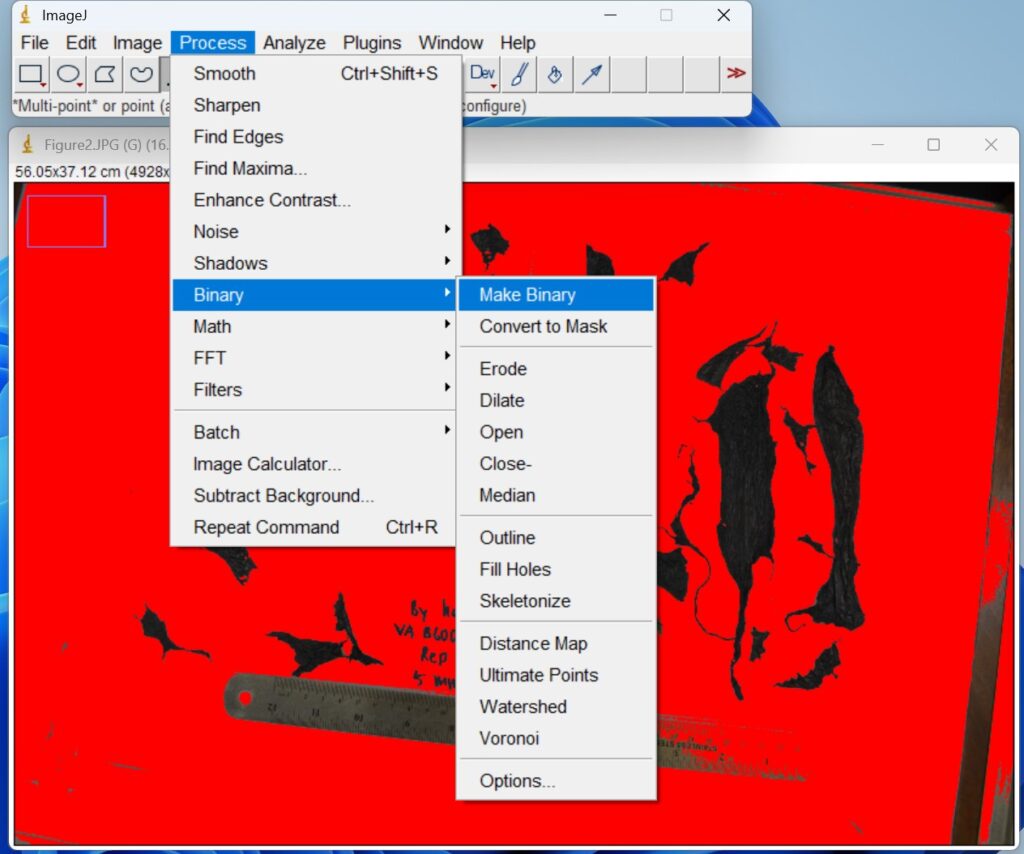
- Click ‘Image → Adjust → Color Threshold’. This step is used to separate plastic mulch fragments in an image based on their color. Then a new window with a red background will open that allows you to adjust the colors.

- Click ‘Process → Binary → Make Binary’. The thresholded images are then converted to binary format to generate masks for quantitative analysis.
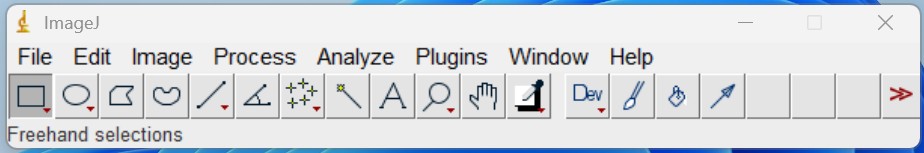
- Draw out the specific image range to be analyzed by clicking the ‘Freehand selections icon’ on the top toolbar. This step is to ensure that the follow-up analysis only focuses on plastic film fragments rather than the ruler and items around the paper.
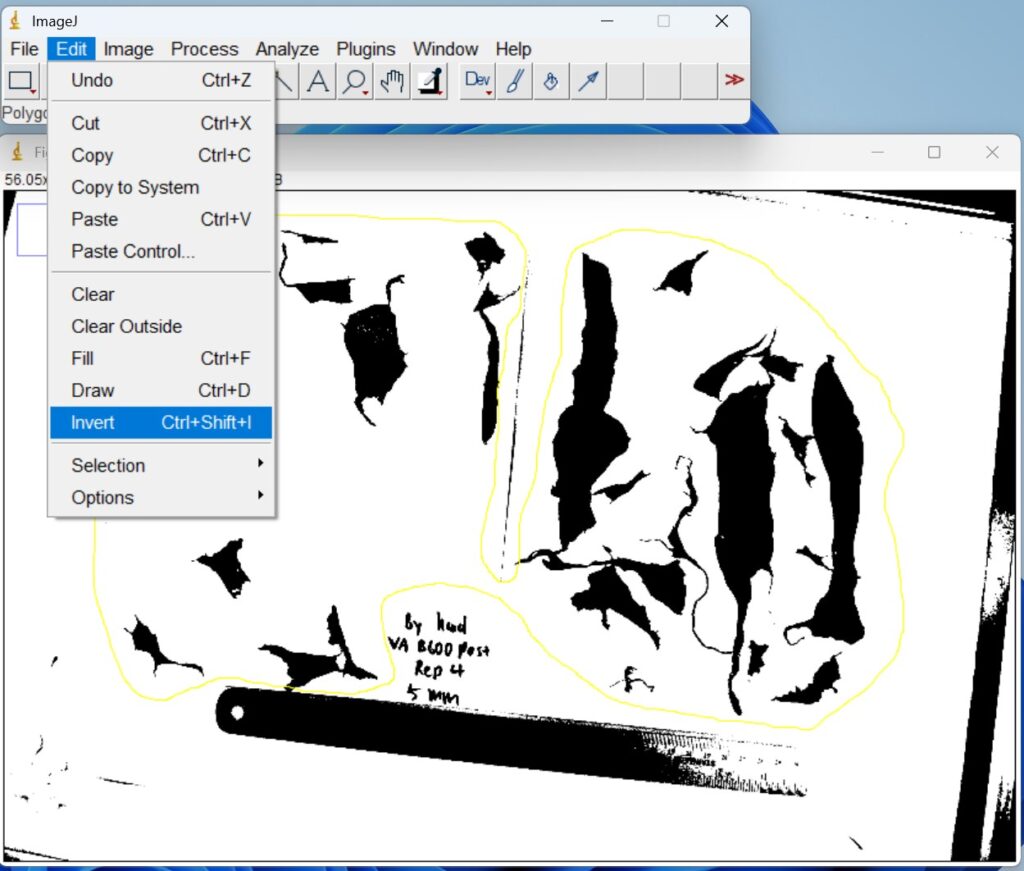
- Click ‘Edit → Invert’. The binary images are then inverted to ensure that the regions of interest were represented as white objects on a black background prior to quantitative analysis.
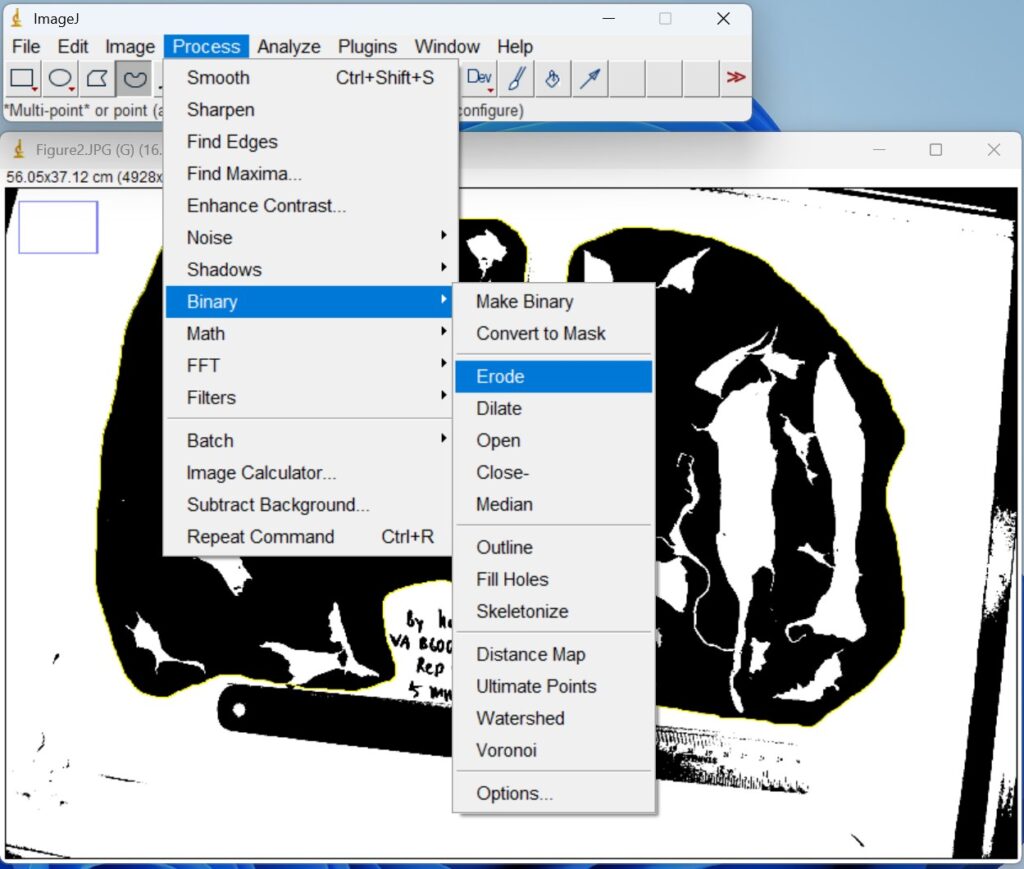
- Click ‘Process → Binary → Erode’, to remove edge noise and separate closely adjacent objects prior to quantitative analysis.
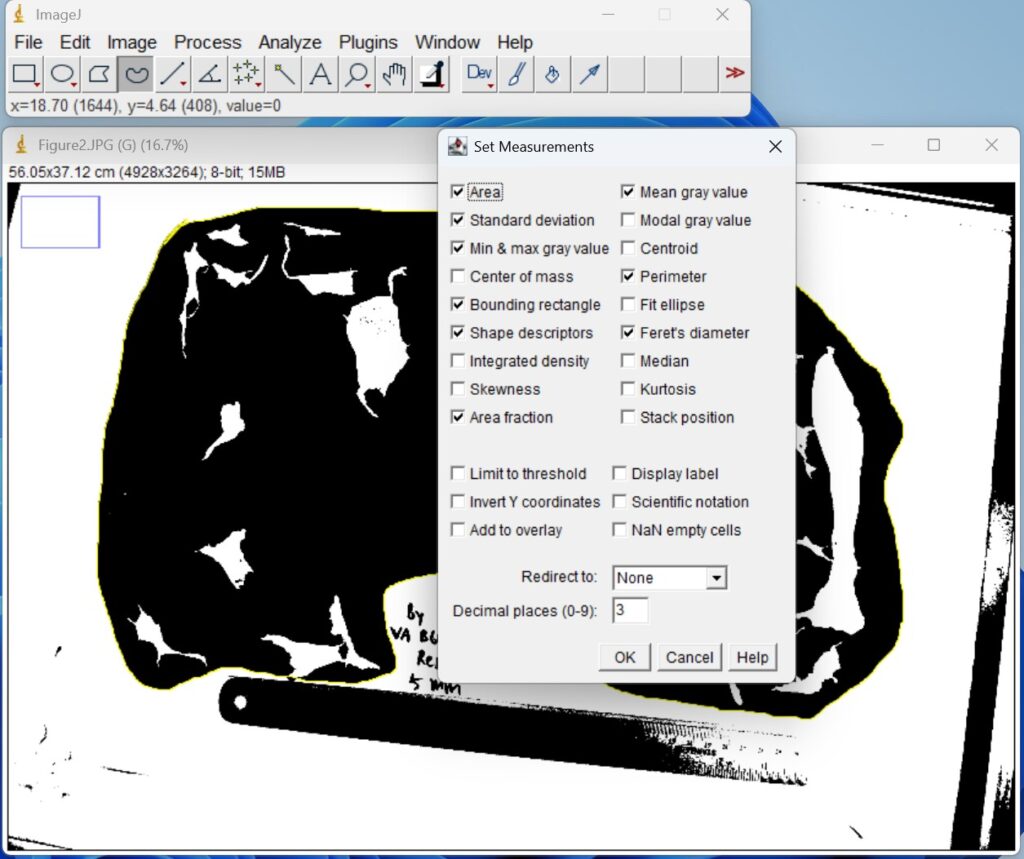
- Click ‘Analyze → Set Measurements’, and then check the indices that you want to measure, for example, as shown below. Then, click ‘OK’.
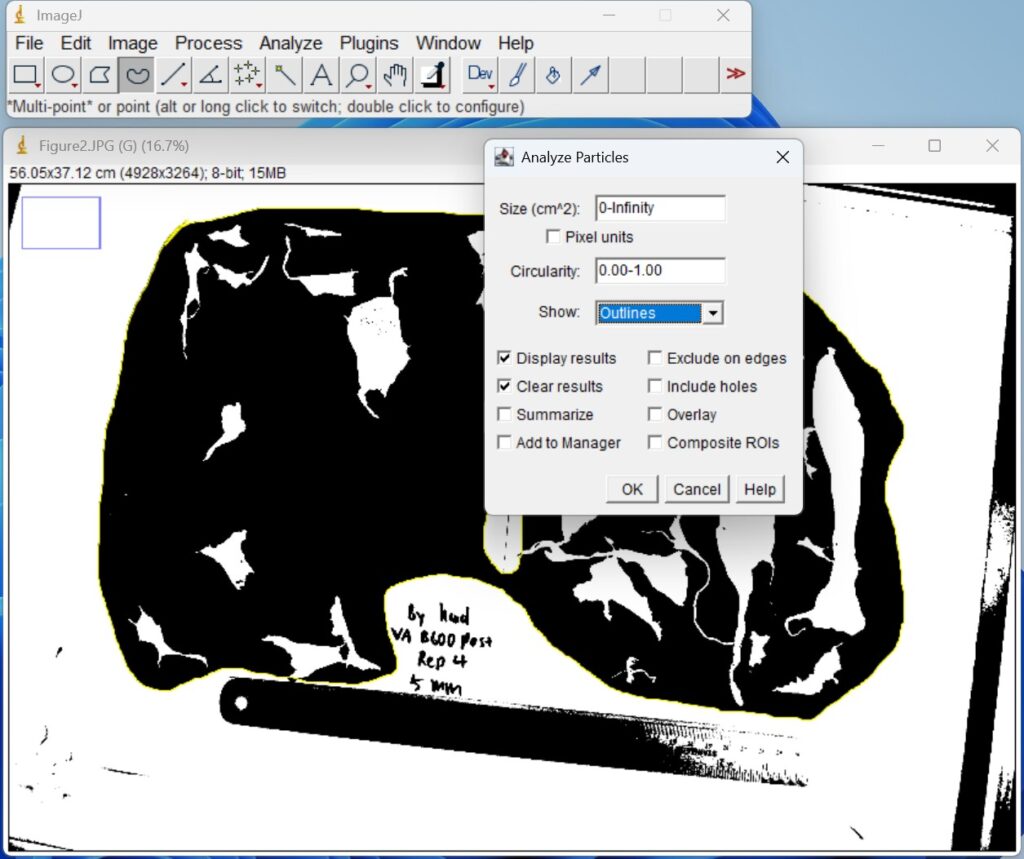
- Click ‘Analyze → Analyze Particles’, show the ‘Outlines’. Then, click ‘OK’.
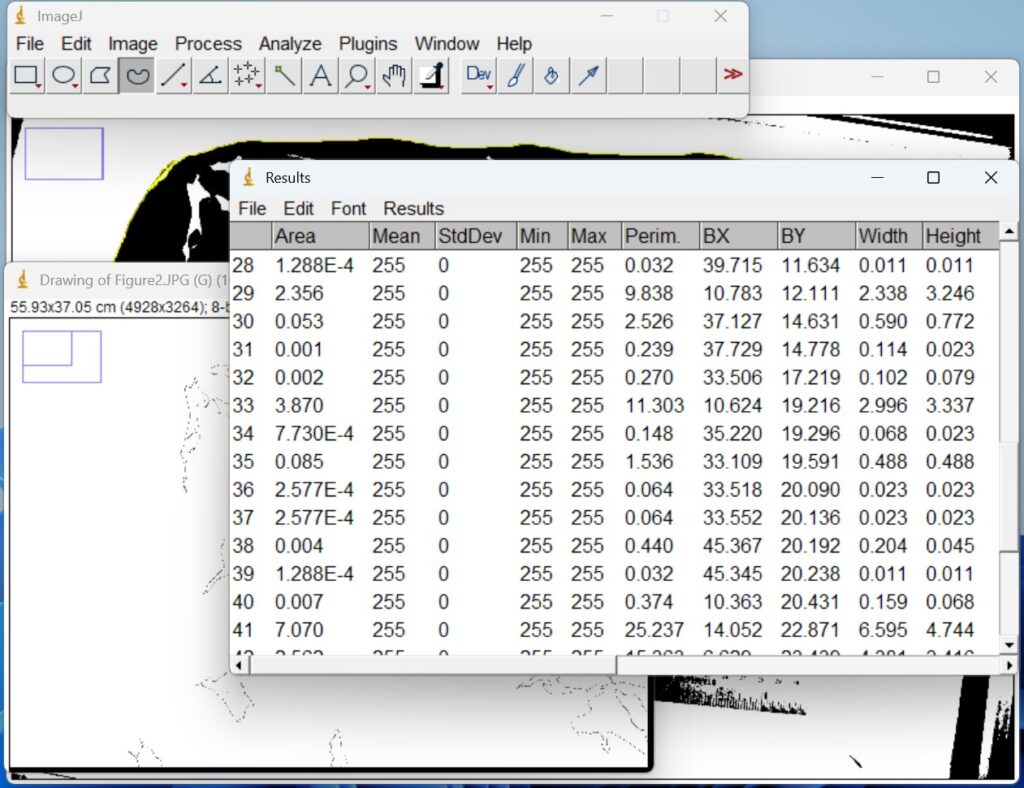
- A summary box with the measurements will appear. Do not close the summary box. All your measurements will show up in this box and you can conveniently download as an Excel file under ‘File’ → ‘Save as’.
This material is based upon work that is supported by the National Institute of Food and Agriculture, under award numbers 2022-51181-38325 & 2016-51181-25404, Hatch Projects 7005372 and 7003737, and CPPM award 2021-70006-35582. Any opinions, findings, conclusions, or recommendations expressed in this publication are those of the author(s) and should not be construed to represent any official USDA or U.S. Government determination or policy. Additional support provided by WSARE under award 2019-51181-30012.

WSU Extension programs and employment are available to all without discrimination. Evidence of noncompliance may be reported through your local WSU Extension Office.