
Soil Sampling Method to Assess the Amount of Plastic Fragments in the Field
Summary
A method to estimate the amount of visible plastic fragments in the soil is presented. This method does not distinguish between biodegradable and non-biodegradable plastic, nor does it directly measure the rate or full extent of biodegradation of soil-biodegradable mulch.
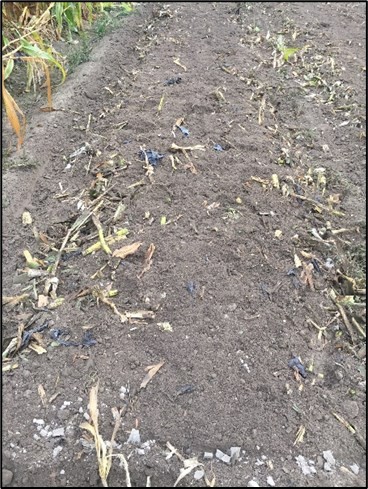
The soil sampling method described in this factsheet can be used to measure the amount of visible plastic fragments in the soil. This method works well for all soil types except sandy soils. Plastic fragments may be from several sources, such as polyethylene (PE; non-biodegradable) mulch or soil-biodegradable plastic mulch (BDM) that is de-signed to be tilled into the soil after use (Fig. 1). This sampling procedure does not distinguish between biodegradable and non-biodegradable plastic, nor does it directly measure the rate or full extent of biodegradation of soil-biodegradable mulch.
Fragments of PE mulch are often left in the soil when mulch is removed at the end of the season. Over time PE fragments are reduced to micro- and nano-particles, resulting in plastic pollution. BDM is tilled into the soil at the end of the season, but there is concern about its potential for slow or incomplete biodegradation under field conditions, which could lead to accumulation of plastics in the soil. It is important for growers to assess the amount of plastic in their fields to determine if their practices are causing plastic waste accumulation in the soil.
Supplies Required
Collecting soil samples:
- A 3 ft × 3 ft frame
- 12-inch ruler
- Shovels
- ≥ 4 ft × 4 ft hard, flat surface (e.g. plywood)
- ≥ 3-gallon bucket
Recovering and measuring mulch fragments:
- Rolling pin, marble or heavyweight
- Table
- Black permanent marker
- Sealable plastic bags (e.g. ½ -gallon Ziploc®)
- Plastic tub (≥ 1-gallon)
- Paper grocery bags (1-gallon)
- Soil sieves: ASTM standard no. 8 (2.38 mm, ≈ 0.1 in.) and no. 10 (2 mm, 0.08 in.)
- Tap water
- White or light-colored tray (20 in. x 10 in.)
- Forceps
- A weighing balance that can read 1 mg to 100 g
- Scissors
Collecting Soil Samples
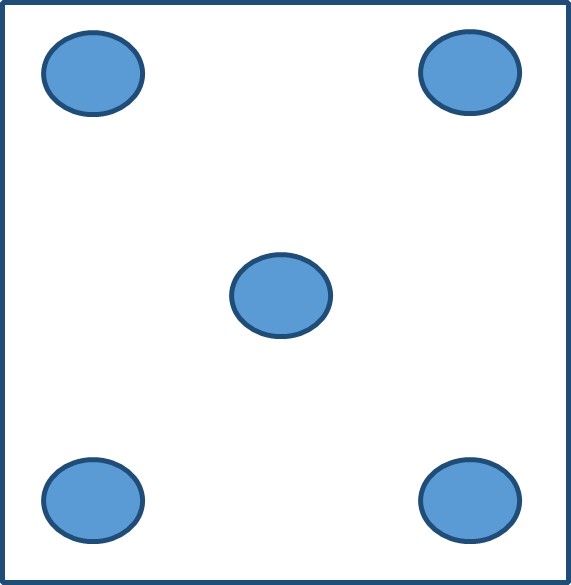
Collect 2–5 representative soil samples from the field you wish to sample. Refer to Table 1 for the number of samples needed to achieve a particular confidence level. Collect the soil samples using an X or Z pattern (Fig. 2), and do not collect samples within about 20 ft of the field edge.
For each soil sample:
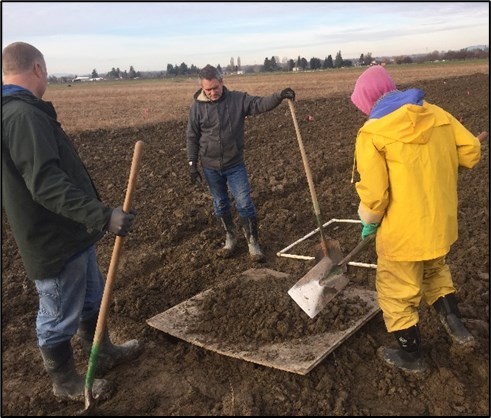
- Place the 3 ft × 3 ft frame on each sampling point in the field, and using a shovel collect soil from within the frame and 6 in. deep (tillage depth); place the excavated soil on a piece of plywood (≥ 4 ft × 4 ft) (Fig. 3).
- Mix the soil thoroughly with the shovel and spread it out as much as possible on the plywood.
- Reduce the amount of soil in the sample using the quartering method: divide the soil into equal quarters by creating two lines intersecting at right angles at the center of the pile, then discard two diagonally opposite quarters (Fig. 4).
- If plastic fragments are found in multiple quarters of the pile while quartering, divide the fragments and place them on the respective quarters.
- Re-mix the sample and carry out the quartering procedure a total of four times, so that the final sample size is ¹⁄₁₆ of the original sample size, which is approximately 2.5 gallons of soil.

Recovering and Measuring Mulch Fragments
Recover the mulch fragments from each soil sample separately:
- If the soil is too wet to crumble easily, spread out each soil sample on a hard, clean surface protected from rain and wind. Check the sample every 1-2 days until it is dry enough to crumble easily between your fingers.
- On a clean table, place about a quarter of the sample at a time and use a marble (heavy) rolling pin to break-up the soil aggregates. At the same time, collect the plastic fragments and place them in a ½-gallon sealable plastic bag. Sieve the soil using the No. 8 sieve and place plastic fragments captured by the sieve into the bag. It will take approximately 30 minutes to process one 2.5-gallon soil sample; however, time can vary depending on soil type, and clay soil will take longer while sandy soil will take less time. Label the bag using a permanent marker to track the source of the sample.
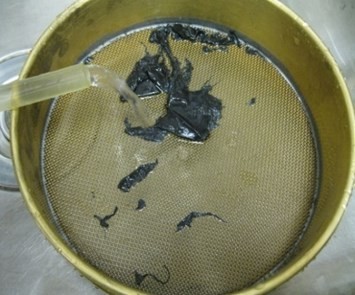
- Place the plastic fragments from one sample at a time in a plastic tub (1 gallon). Add water to the tub and gently agitate the plastic fragments with your hands to remove any adhering soil. Pour the water out through the no. 10 sieve to capture the plastic pieces (Fig. 5). Add the plastic fragments back to the tub and repeat the process until you remove as much soil as possible. Be aware that soil can damage plumbing, so best to wash the samples in an outside area and not in a sink.
- Place the clean plastic fragments in a labeled paper bag and air dry. Once the plastic fragments are dry, spread them on a white or light-colored tray and use forceps to remove any debris that may be present.
- Weigh the plastic mulch collected from each sample separately. This requires a precision balance that can read 1 mg to 100 g.
- Add together the weight of plastic in each sample to obtain the total weight of plastic for all the collected samples.
- Calculate the average weight of plastic per sample (total weight divided by number of samples).
- Calculate the recovered mulch weight per acre using the equation below and Table 2.
- Calculate the recovered area of mulch per acre from the average weight of mulch per acre using the equation below.
- Calculate the relative standard deviation to determine if you have collected enough soil samples based on your chosen confidence level. The confidence level determines the degree of certainty for the result. For example, at the 90% confidence level you can be 90% certain that your samples represent the status of the whole field.
Calculate the weight of mulch from the soil samples:
For example,
- The weight of plastic recovered in each of the 5 samples is 0.8, 1.2, 1.0, 1.1 and 0.9 g
- Total plastic recovered from 5 samples = 5 g
- The weight of mulch/acre = 5 × 15,4881 = 77,440 g = 77.44 kg
See Table 2 for this multiplication factor, which is based on the number of samples.
Calculate the area of mulch from the weight of mulch:
- Total area of mulch per acre = weight of mulch / (density of mulch × thickness of mulch)
- Mulch density:
- BDM: 1.37 g/cm3
- PE mulch: 0.94 g/cm3
- Assumption of thickness of mulch: 1 mil = 0.00254 cm
- Using the above example, recovered mulch per acre = 77,440 g / (1.37 g/cm3 × 0.00254 cm) = 22,254,152 cm2 or 23,954 ft2
Calculate the relative standard deviation of the mulch samples:
Using the above example:
- Calculate the average weight of the mulch in all the soil samples.
Average = (0.8 + 1.2 + 1 + 1.1 + 0.9) / 5 = 1 - For each sample, subtract the average then square the difference. Then, calculate the average of the squared differences.
= [(0.8 – 1)2 + (1.2 – 1)2 + (1 – 1)2 + (1.1 – 1)2 + (0.9 – 1)2] / 5 = 0.02 - Calculate the standard deviation by taking the square root of the average squared difference.
= √0.02 = 0.1414 - Calculate the relative standard deviation by multiplying the standard deviation by 100 and dividing the product by the average.
= (0.1414 × 100) / 1 = 14.14%
Based on the relative standard deviation in Table 1, determine the number of soil samples you need to collect to attain your desired level of confidence. Table 1 provides four confidence levels, 95%, 90%, 85% and 80%. It is up to you to determine how confident you would like to be in your assessment. For example, at 85% confidence, if the relative standard deviation value is 14%, then 5 soil samples are enough. However, if you get a relative standard deviation value of about 20, at the 85% confidence level, you need 8 soil samples in total.
Table 1
Number of soil samples required based on the relative standard deviation (RSD) of the amount of mulch recovered in soil samples, with 95%, 90%, 85% and 80% confidence.
| RSD | No. of samples to collect for confidence level | |||
|---|---|---|---|---|
| 95% | 90% | 85% | 80% | |
| 2 | 5 | 3 | 2 | 2 |
| 5 | 10 | 4 | 3 | 2 |
| 8 | 19 | 6 | 4 | 3 |
| 11 | 30 | 8 | 4 | 3 |
| 14 | 45 | 11 | 5 | 4 |
| 17 | 62 | 15 | 7 | 4 |
| 20 | 81 | 18 | 8 | 5 |
| 25 | 120 | 26 | 11 | 6 |
| 30 | 167 | 35 | 14 | 8 |
| 35 | 222 | 45 | 18 | 9 |
| 40 | 284 | 57 | 22 | 11 |
| 45 | 354 | 70 | 27 | 13 |
| 50 | 431 | 84 | 32 | 16 |
Table 2
Calculation of the weight of recovered mulch per acre based on 9 ft2 per soil sample.
| No. of samples | Sample collection total area (ft2) | Multiplication factor for weight of mulch/acre1 |
|---|---|---|
| 3 | 27 | 23,813 |
| 5 | 45 | 15,488 |
| 6 | 54 | 12,907 |
| 7 | 63 | 11,063 |
| 8 | 72 | 9,680 |
| 9 | 81 | 8,604 |
| 10 | 90 | 7,744 |
| 11 | 99 | 7,040 |
| 12 | 108 | 6,453 |
Literature Cited
- Ghimire, S. 2018. Biodegradable mulch for pumpkin and sweet corn production: Crop yield and quality, and mulch degradation. Washington State University PhD dissertation. p 132.
- Ghimire, S., A. Saxton, A.L. Wszelaki, J.C. Moore, and C.A. Miles. 2017. Reliability of soil sampling method to assess visible biodegradable mulch fragments remaining in the field post soil-incorporation. HortTechnology 27:650-658.
- Hablot, E., S. Dharmalingam, D.G. Hayes, L.C. Wadsworth, C. Blazy, and R. Narayan. 2014. Effect of simulated weathering on physicochemical properties and inherent biodegradation of PLA/PHA nonwoven mulches. J. Polym. Environ. 22:417-429.
- Hayes, D and M. Flury. 2018. Summary and assessment of EN 17033:2018, a new standard for bio-degradable plastic mulch films. 22 Aug. 2018.
- Kijchavengkul, T., R. Auras, M. Rubino, M. Ngouajio, and R.T. Fernandez. 2008. Assessment of aliphatic-aromatic copolyester biodegradable mulch films. Part II: Laboratory simulated conditions. Chemosphere 71:1607-1616.
- Lucas, N., C. Bienaime, C. Belloy, M. Queneudec, F. Silvestre, and J.E. Nava-Saucedo. 2008. Polymer biodegradation: Mechanisms and estimation techniques – A review. Chemosphere 73:429-442.
This material is based upon work that is supported by Western Sustainable Agriculture Research and Education, under award number WPDP19-05. Any opinions, findings, conclusions, or recommendations expressed in this publication are those of the author(s) and do not necessarily reflect the view of the U.S. Department of Agriculture. Any opinions, findings, conclusions, or recommendations expressed in this publication are those of the author(s) and should not be construed to represent any official USDA or U.S. Government determination or policy.

WSU Extension programs and employment are available to all without discrimination. Evidence of noncompliance may be reported through your local WSU Extension Office.